In today’s rapidly evolving business landscape, staying ahead of the competition requires more than just a great product or service. It demands a deep understanding of the market, consumer behavior, and emerging trends. This is where the market research process becomes invaluable. In this blog post, we will delve more into market research and explore...
There is never a wrong time to do market research. However, most research projects are birthed because a company or organization is at a crossroads. Whether you’re a startup or Fortune 500 company, you’ll have critical decisions to make. This blog will detail common market research examples and how our clients have used them to...
A conjoint analysis is one of the most effective ways to help a brand determine the best product features, benefits, and price combinations.
When measuring the appeal of a new product concept, it can prove challenging to assess the relative value of each benefit properly. That’s why researchers often rely on a structured conjoint study to simulate real-world decision-making and uncover what matters most to customers.
Trying to tackle this through a series of closed-ended questions (select one, select all that apply, ranking) coupled with open-ended questions for context can create a muddy story – one that is hard to apply when deciding on the design of a product.
In this guide we’ll go through what conjoint analysis is, how to do a study, some example questions, how to analyze conjoint data, and what conjoint data can tell.
Design products customers love. Connect with us for a custom conjoint analysis project.
A conjoint analysis in the market research world is a scientific way to better understand consumer behavior and a natural way to replicate how they would choose a product.
Through this approach, the process can be boiled down to a series of questions where you simply ask the customer which of these packages you would be most likely to purchase.
The back-end analysis of conjoint surveys gives the market research firm the option to single out the relative value of each product feature.
Conjoint design typically breaks down responses in analysis, allowing researchers to identify which features drive the most value, how pricing influences choices (conjoint analysis pricing), and which combinations are most appealing to respondents.
How to Conduct a Conjoint Study
For a real-world conjoint example, let’s say you have been tasked with designing a new sport utility vehicle (SUV).
It’s important to know what you’re doing when it comes to conjoint studies (or to work with an expert partner, like us) since every step (from survey design to data analysis) matters to get reliable results.
You hire a conjoint analysis company to help you construct the survey, collect data, interpret the results, and recommend the best package of features/benefits to go to market.
Pro Tip: Use qualitative exploratory research as the first step before conducting a conjoint survey. Qualitative research will help you dive deeper into the consumer mindset to help you refine the list of levels and attributes you want to measure. Although qualitative research can serve as an excellent pre-test, it can provide additional context and quotes to supplement your more sophisticated quantitative research.
Step 1: Define Attributes and Levels
The first step of a conjoint analysis study is determining the attributes and levels you want to address in your survey.
The attribute is considered as the categories you see below (size, fuel source, etc.), while the levels are the details/options for each category (2WD, AWD, 4WD for the platform).
Size: Compact SUV, Mid-size SUV, Full-size/extended-length SUV
Fuel source: Gas-powered, hybrid, fully electric
Platform: 2WD, AWD, 4WD
Towing package: Included or not included
Price: $35,000, $45,000, $55,000, $65,000
These combinations form the building blocks of your conjoint study design. Next, you’ll consider exactly how many attributes to test in your survey.
Step 2: Balancing The Number of Attributes
A common question we get is, “how many attributes should I test? If you are asking about the optimal number of attributes to cover in your conjoint, consider 6 or fewer.
Drive Research recommends striking the right balance between obtaining enough depth to your model and, at the same time, not overwhelming respondents.
Any more and respondents will have difficulty weighing options and might resort to simplification strategies, such as ignoring one attribute altogether.
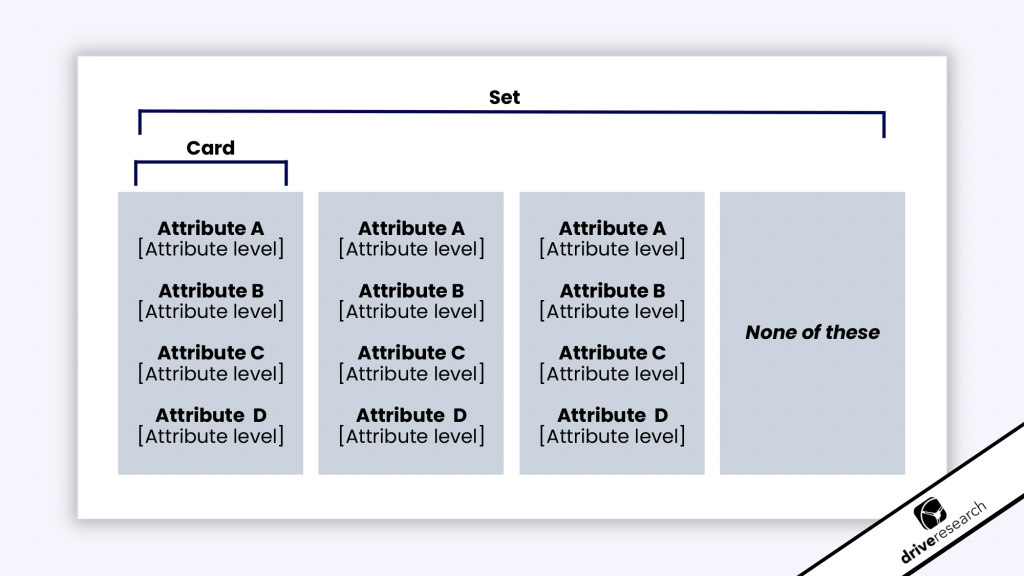
An expert in this space will recommend the number of sets, cards per set, and attribute levels per set.
Based on the number of attributes and levels, a market research consultant can help you determine the appropriate number of cards and sets for your CBC design.
Step 3: Design Your Conjoint With Logic
If you’re working with an expert on your conjoint study (like us), they can also help design prohibited level pairs.
If the conjoint designed cards were shown randomly with different levels within each attribute and an associated price, the card combinations might not make any sense.
For example, a card may show all of the high-end features of the SUV and add-on packages but would be coupled with the lowest price.
Vice-versa, you may see a card with low-end features/add-ons coupled with the highest price.
Setting up prohibited pairs through logic prevents this.
The survey platform would also allow programming to prevent duplicate cards or combinations from being shown to the same respondent. It also ensures the sequence of cards being shown all have an equal show rate.
Understand feature value. Contact our experts to learn about conjoint analysis solutions.
You have a few format options to consider for your conjoint design. Each option has its own advantages, depending on the product being tested and the type of conjoint analysis results you’re seeking.
A good market research firm can help you understand the pros and cons of each and guide youpick the right formatting.
Additionally, the survey programming design will help rotate the levels within each attribute.
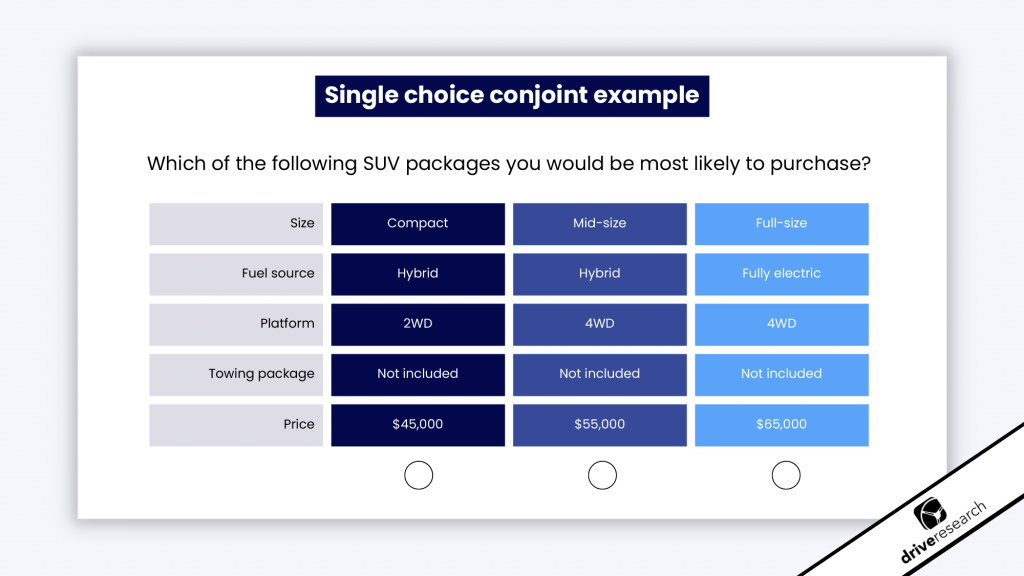
In this exercise below, you would ask the respondent which of the following SUV packages you would be most likely to purchase.
The cards include a random mix of levels for each attribute, creating a series of cards. The respondent is asked to choose a single card.
Another option for the single choice is including a fourth card detailing an answer option for none of these.
Doing so helps mirror realistic choices for respondents since they have the option to walk away in the real world.
Therefore, including this option is especially important for testing market potential and even determining product price, like in a conjoint pricing study.
A market research consultant, like Drive Research, can discuss the advantages and disadvantages of offering this as a selection or forcing a respondent to choose one of the provided cards.
Here are some single-choice conjoint example questions: 1. Which of the following SUVs would you be most likely to purchase? a. SUV A: 20 MPG, $32,000 b. SUV B: 28 MPG, $36,000 c. SUV C: 35 MPG, $40,000 d. None of these
2. Which of these SUV options would you prefer? a. SUV A: 5 seats, standard safety features, $29,000 b. SUV B: 7 seats, advanced safety package, $34,000 d. SUV C: 8 seats, luxury interior + safety package, $42,000 d. None of these
3. Which of the following SUVs appeals to you most? a. SUV A: 4-cylinder engine, 3-year warranty, $31,000 b. SUV B: V6 engine, 5-year warranty, $38,000 c. SUV C: Hybrid engine, 7-year warranty, $44,000 d. None of these
4. If these were your only choices, which SUV would you purchase? a. SUV A: Basic infotainment, cloth interior, $28,000 b. SUV B: Premium infotainment, leather interior, $37,000 c. SUV C: Premium infotainment + driver-assist tech, luxury interior, $45,000 d. None of these
5. Which SUV package would you choose? a. SUV A: Lesser-known brand, low resale value, $26,000 b. SUV B: Well-known brand, average resale value, $35,000 c. SUV C: Premium brand, high resale value, $48,000 d. None of these
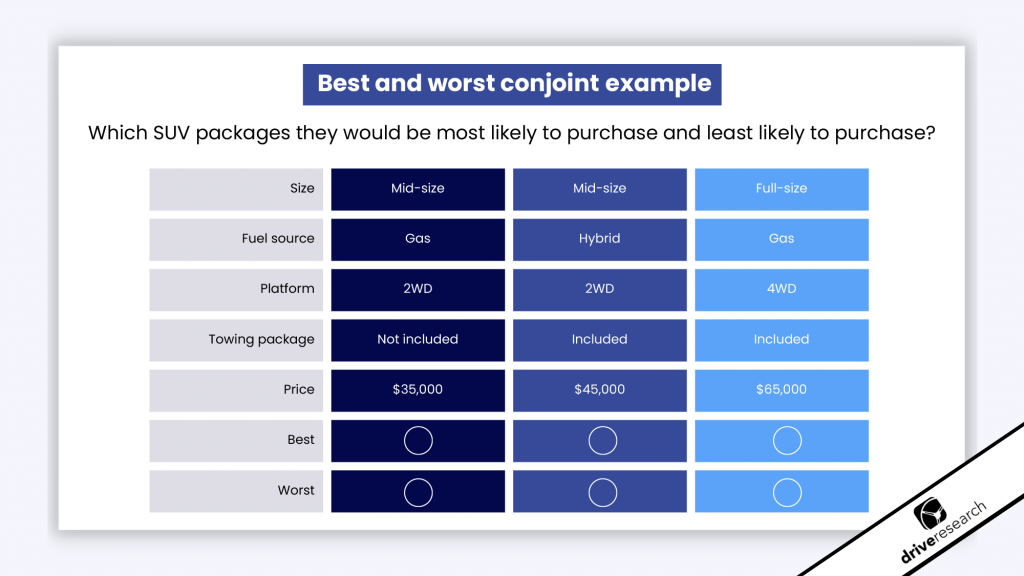
Option 2: Best and worst conjoint
The option for conjoint surveys is similar to the single choice but forces the respondent to make 2 selections in each exercise which includes a best and worst option.
Best and worst conjoint is just like the MaxDiff technique in which respondents make two opposite selections per set of attributes.
This best and worst conjoint creates an additional layer of variance in the data to create separation of the data versus singling out only the most preferred in the single choice approach in Option 1.
In this option, you ask the respondent which SUV packages they would be most likely to purchase and least likely to purchase.
Here are some example best and worst conjoint questions: 1. Which SUV would you be most likely to purchase (best), and which would you be least likely to purchase (worst)? a. SUV A: $28,000, 22 MPG b. SUV B: $34,000, 30 MPG c. SUV C: $42,000, 36 MPG
2. Please select the best and worst option from the choices below. a. SUV A: Standard safety features, basic infotainment, $29,000 b. SUV B: Advanced safety package, premium infotainment, $37,000 c. SUV C: Standard safety features, premium infotainment, $33,000
3. Out of the following SUV options, choose the one you’d be most likely to purchase (best) and least likely to purchase (worst). a. SUV A: 5 seats, cloth interior, $30,000 b. SUV B: 7 seats, leather interior, $38,000 c. SUV C: 8 seats, luxury interior, $45,000
4. Which SUV option would you consider best, and which would you consider worst? a. SUV A: 4-cylinder, 3-year warranty, $31,000 b. SUV B: V6 engine, 5-year warranty, $39,000 c. SUV C: Hybrid engine, 7-year warranty, $46,000
5. Select one SUV as best and one as worst in terms of likelihood to purchase. a. SUV A: Emerging brand, low resale value, $27,000 b. SUV B: Well-known brand, average resale value, $36,000 c. SUV C: Premium brand, high resale value, $50,000
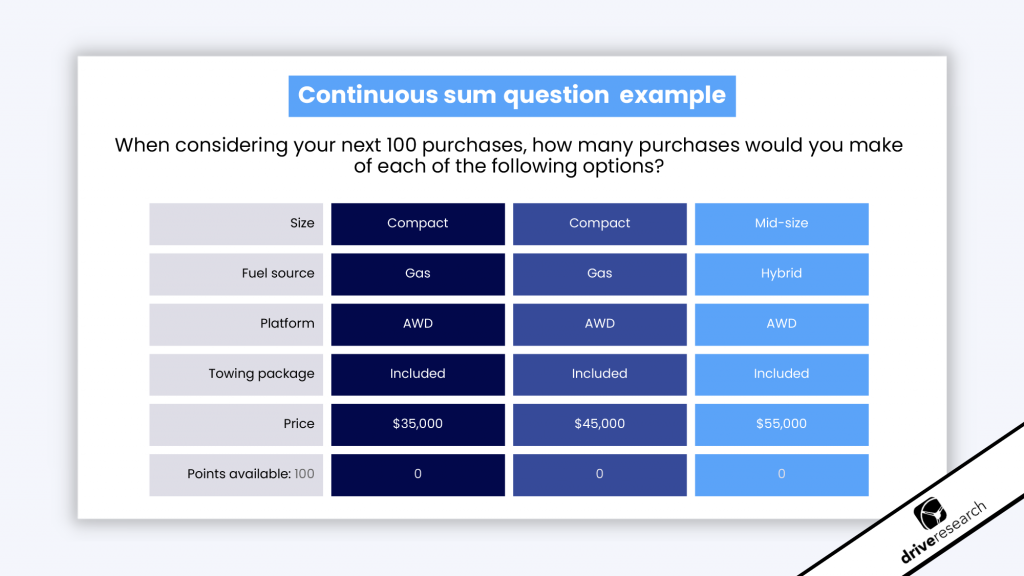
Option 3: Continuous sum
Continuous sum is not always the best option for conjoint studies in market research.
It depends on the product you are offering. Where it makes the most sense is when a consumer owns more than one or decides to purchase multiple in a single shopping experience.
In this example, with an SUV, it’s doubtful a consumer would be buying 2 SUVs at one time.
A better fit for a continuous sum exercise might be a project where you determine the relative value of attributes for a product like frozen dinners, clothes, snacks, etc.
In those cases, you may purchase more than one item where you would spread chips or points across multiple options.
A continuous sum question works when you are allocated a specific number of points or chips (in this case below, and very typically, 100).
The respondent takes those 100 points and enters them to indicate how much they value each card set.
In other words, you may ask the question to the respondent when considering your next 100 purchases, how many purchases would you make of each of the following options?
Here are some more conjoint continuous sum questions: Imagine you are allocating 100 points to show how likely you are to purchase each SUV option below. How many points would you give each one? SUV A: $32,000, 25 MPG, standard safety features SUV B: $38,000, 30 MPG, advanced safety features SUV C: $42,000, 35 MPG, hybrid engine + advanced safety features Using 100 points, allocate how much preference you would give to each of these SUV options. SUV A: Premium brand, $50,000, luxury interior SUV B: Mid-tier brand, $38,000, balanced features SUV C: Value brand, $28,000, fewer features Distribute 100 points to show how appealing each of these SUV packages is to you. SUV A: Basic infotainment, cloth seats, $29,000 SUV B: Premium infotainment, leather seats, $37,000 SUV C: Advanced infotainment + driver-assist tech, luxury interior, $45,000 If you were to spread 100 points across the following SUV options, how much value would you assign to each? SUV A: 4-cylinder, 3-year warranty, $31,000 SUV B: V6 engine, 5-year warranty, $39,000 SUV C: Hybrid engine, 7-year warranty, $46,000 Allocate 100 points to show how much each SUV fits your needs. SUV A: 5 seats, $29,000, basic safety features SUV B: 7 seats, $36,000, advanced safety features SUV C: 8 seats, $44,000, advanced safety + entertainment package
Analyzing Conjoint Survey Data
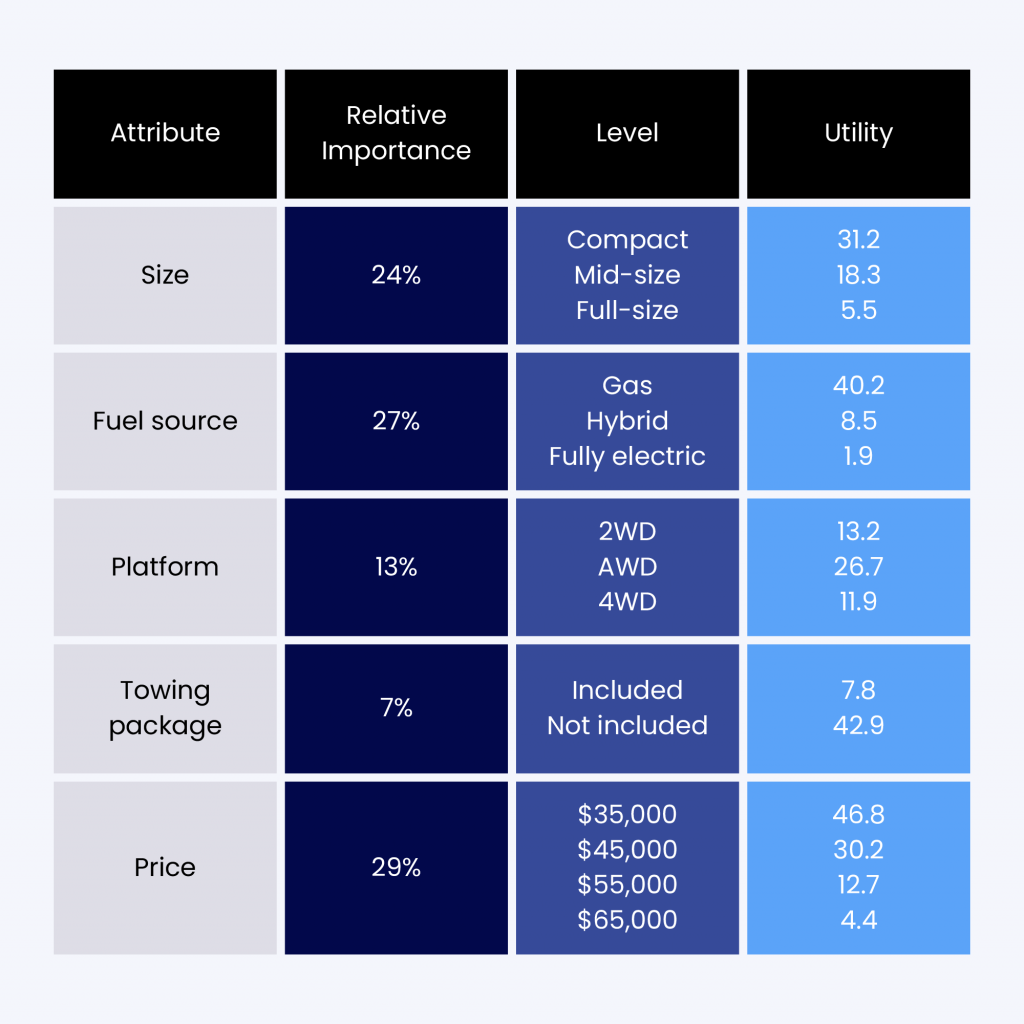
Once you have set up and run your conjoint survey design, that’s only half the battle. That’s because a big part of the analysis for conjoint is putting together a part-worth utility graph.
The term utility in conjoint is a measure of value or worth for each level. The higher the number for the utility, the more desirable the feature or benefit of the attribute.
Therefore, those levels with the highest utility scores are the ones that will drive respondent choice.
You will also calculate the relative importance of each attribute overall. The relative importance of all attributes will always total 100%. This is an excellent indicator to help you interpret which categories are critical to consumer decision-making.
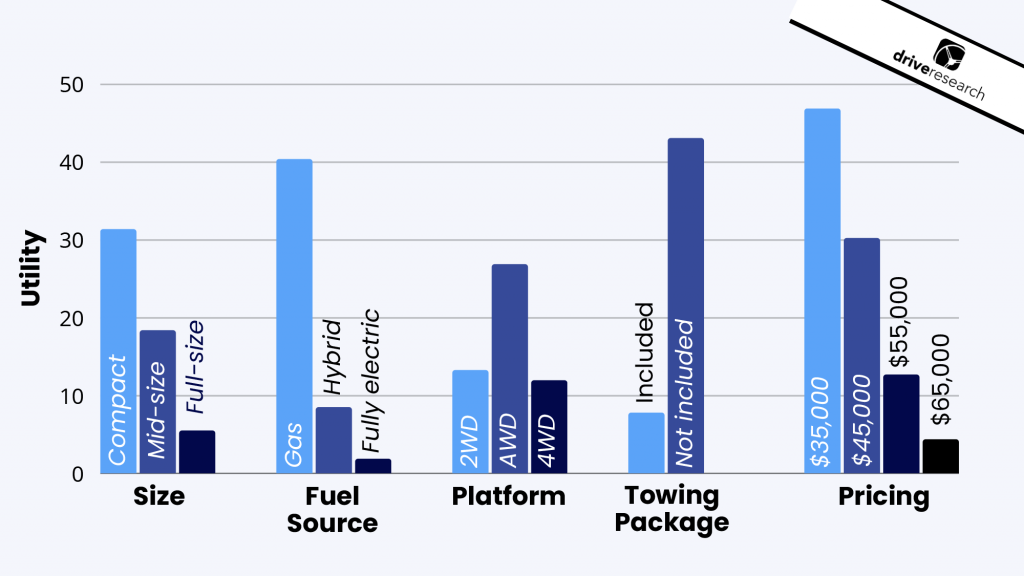
When interpreting both the bar graph and chart below, it is important to note that the value (utility score) is meaningless without context..
More important is the relative value between the attributes and levels when compared to one another Comparing the values highlights trade-offs customers are willing to make, giving brands a clearer picture of how to position products, test pricing strategies, or refine offerings.
It is crucial to note that utility values of one attribute level cannot be compared to the utility values of levels for another attribute. Utilities for levels must be evaluated within the context of an attribute. Relative importance values of whole attributes are the metrics that can be compared with one another between attributes.
What Does Conjoint Analysis Tell Us?
Conjoint analysis provides a wealth of insights on consumer preferences and how decisions are made. Instead of asking people directly, it uncovers the underlying thinking behind their choices by simulating real decision-making scenarios. The most straightforward outcomes of conjoint analysis include:
Attribute Importance
At the highest level, conjoint analysis can provide insights on the relative importance of individual product features. Conjoint analysis tells us where consumers place the most value when it comes to decision-making. From our hotel room example, this would tell us the relative importance of room type, leisure activities, dining options, and price.
Utility Values
Conjoint analysis also delivers utility values, which measure the perceived value of each attribute level. From our hotel room example, this would tell us how much consumers prefer a room with 1 King Bed, compared to 1 Queen Bed, or 2 Queen Beds.
Understanding these differences is key for making product, service, or conjoint analysis pricing decisions based on data.
Conjoint analysis can also be much more involved, and address more complex questions organizations might have about their product or service. Some other outcomes of conjoint analysis include:
Market Share Simulations
How would changes to our product or service impact our market share? What combination of features would allow us to maximize market share?
Conjoint analysis can help organizations understand where they stand in the market, and how adjustments to a product will impact market share. Simulations can be run with the overall audience, but also be narrowed down to key audiences (such as by generation or other key segments).
If the base case of market shares are not reflective of reality, adjustments known as interaction effects can be added to the conjoint model to calibrate the data. This may be necessary to make the conjoint results more actionable for your business.
Willingness to Pay
How important is price in overall decision-making? How much are consumers willing to pay for different features? It shows how much value customers place on specific features and how sensitive they are to price changes. Conjoint analysis can provide insight into the importance of pricing for specific products as well as the perceived value of individual product features.
Segmentation
Are there distinct groups of consumers? What are the preferences of each segment? What behaviors and motivations exist for each segment? Conjoint analysis can be highly valuable when it comes to segmenting consumers and helps organizations with creating effective strategies to reach each segment.
Make data-driven product decisions. Reach out for a conjoint analysis consultation.
Conjoint analysis is critical for organizations looking to better understand what drives decision-making among potential customers.
While conjoint analysis can be more complex and often requires a larger investment, it provides much more value to organizations when compared to traditional research techniques.
Unlike traditional surveys that ask respondents to rank or rate features, a conjoint study simulates real-world buying scenarios where consumers often face trade-offs.
This leads to better differentiation in the data and more reliable results.
Conjoint analysis reduces the risk of brands guessing wrong. Investments in new products, pricing structures, or service bundles are costly, and relying on “stated preference” data alone can sometimes lead to misleading results.
Conjoint analysis can also be valuable to a wide range of industries in a variety of situations. A few examples of conjoint analysis providing value include:
New product development
Product optimization
Demand forecasting
Consumer segmentation & persona development
Price strategy & revenue optimization
Marketing & communication strategy
H3: Why Consider a Conjoint Research Partner
While it’s possible to carry out a conjoint analysis on your own, the design and interpretation are complex. Poorly structured attributes or unbalanced levels can lead to unreliable results and possibly even a confusing survey for respondents.
A research partner ensures the survey is properly designed, statistically reliable, and tailored to your business goals. From survey programming to data cleaning and advanced modeling, an experienced team translates raw data into clear, actionable recommendations.
Ultimately, conjoint analysis is a versatile tool that can be used to improve strategic decision-making in any industry. It offers valuable insights into customer preferences, which can be used to make informed decisions about product development, pricing, or marketing.
Market Simulators for Conjoint Analysis
Another key output from a conjoint analysis is a market simulator. Think of it as a “what-if” tool for decision-making.
A market simulator is a tool typically in an Excel spreadsheet format that allows you to make quick sense of the part-worth utilities for each attribute.
The market simulator has built-in formulas that make it easy to use.
Simply adjust the attribute levels for one or more simulated offerings you would like to review.
The total utility value is then calculated for each offering by automatically summing all the part-worth utilities associated with the attribute levels you selected.
This lets you assess the relative value of any combination of attribute levels.
You may be thinking, “Can’t I just create an offering that consists of the levels with the highest part-worth utilities for each attribute?
While this would be the “ideal” offering in the eyes of the consumer, it is not always feasible or the most profitable combination.
Here is a great webinar to bookmark by Sawtooth Software that dives into using a market simulator for conjoint surveys.
Benefits of a market simulator
The beauty of a market simulator is that you can see how multiple combinations of attribute levels compare to one another as if they were all on the shelf.
A share is also calculated for each potential offering in real-time to predict what percent of consumers would actually buy it versus the other simulated offerings.
Additionally, you can effectively play around with the attribute levels for each offering in countless scenarios.
These comparisons could include…
Your business’ own offerings
Competitive offerings
New potential offerings
A combination of the three
The estimated market share for each potential offering can be used to make decisions about introducing a new product, refining your existing product portfolio, or the expected impact of new competitive products.
Conjoint Analysis Case Study
Background
A leading U.S.-based windows and doors manufacturer, known for innovation and market leadership, was preparing to launch a new double-hung window in its entry-level product line. With a portfolio spanning five distinct product lines, the company wanted to assess how this new offering might influence its existing sales mix and impact key competitors. This case study focuses on insights gathered from the professional division, which sells to dealers for new construction and remodeling projects.
Business Challenge
The company faced a familiar but complex question: would this new product expand market share or primarily cannibalize existing sales within its own portfolio? More specifically, the client wanted to measure potential risk to its mid-tier and premium product lines and estimate the share shifts among major competitors.
Research Objectives
To guide strategic decision-making, the research aimed to answer:
How much cannibalization would the new window cause within the company’s own product lines?
Would the new offering capture share from competitors, and if so, which brands were most vulnerable?
Which product features and price points drive consumer preferences in the replacement and remodeling markets?
The research was grounded in a choice-based conjoint (CBC) study – a proven statistical technique that simulates real-world trade-offs consumers make when evaluating products. It helps estimate how different features, brands, and prices influence purchase decisions.
Survey Design
Respondents were shown a series of 15 product selection tasks. Each task featured four product options randomly generated from six key attributes, plus a “None” option to simulate a realistic shopping environment:
Brand: National and regional players including well-known competitors and private-label options
Style: Single Hung vs. Double Hung
Material: Composite, Vinyl, and Wood Clad
Color: Basic (White or Tan) vs. Premium (White, Tan, or Black)
Glass Performance: Dual Pane vs. Triple Pane
Price per window: Ranged from $200 to $700 in $100 increments
This design allowed for robust modeling of consumer preference structures, price elasticity, and projected market share.
Key Outcomes
Cannibalization vs. Competitive Gain: The results showed that the new product would indeed draw some volume from higher-tier internal lines but would also pull significant share from comparable competitor offerings, particularly at mid-range price points.
Feature Valuation: Consumers placed high importance on material and style, with composite double-hung windows preferred over single-hung or vinyl alternatives.
Price Sensitivity: While price was a key factor, the model identified several scenarios where consumers were willing to trade up if certain high-value features (like black trim and triple-pane glass) were present.
Strategic Impact
The conjoint model provided a simulated market environment showing how the new product would perform against existing products in the portfolio and among competitors. The insights enabled the client to:
Optimize product positioning and pricing strategy
Mitigate internal cannibalization through targeted messaging and packaging
Quantify expected gains from competitors to support a confident go-to-market strategy
Drive Research is a full-service market research company specializing in concept testing and conjoint studies. Our team can recommend the best approach and survey design to execute a successful conjoint study.
To learn more about our services, contact Drive Research today.
We analyze more than data—we also track how our site is used to improve your experience. Cookies help us understand what’s working so we can deliver the most relevant insights. Click “Accept” to enable full functionality.
Functional
Always active
The technical storage or access is strictly necessary for the legitimate purpose of enabling the use of a specific service explicitly requested by the subscriber or user, or for the sole purpose of carrying out the transmission of a communication over an electronic communications network.
Preferences
The technical storage or access is necessary for the legitimate purpose of storing preferences that are not requested by the subscriber or user.
Statistics
The technical storage or access that is used exclusively for statistical purposes.The technical storage or access that is used exclusively for anonymous statistical purposes. Without a subpoena, voluntary compliance on the part of your Internet Service Provider, or additional records from a third party, information stored or retrieved for this purpose alone cannot usually be used to identify you.
Marketing
The technical storage or access is required to create user profiles to send advertising, or to track the user on a website or across several websites for similar marketing purposes.