
If you have ever explored advanced market research techniques, there is a good chance you have come across choice-based conjoint analysis (CBC) studies.
Although it may be more involved than a simple project, a well-designed conjoint survey has the potential to generate key insights about optimizing your product or service.
This post dives into what choice-based conjoint analysis is, how to conduct them, when to use them, and real-world examples.
Explaining Choice-Based Conjoint Analysis
Choice-based conjoint analysis is an advanced survey technique in which respondents make choices based on combinations of various product attributes.
It is also referred to as CBC or discrete choice conjoint analysis.
Benefits of Conducting a Choice-Based Conjoint Study
What sets conjoint analysis apart from other survey approaches to product optimization is how respondents must factor all the features into their decision-making.
As consumers, it’s easy to say everything is important in a product (i.e. price, quality, quality, customer service).
But, this information is not very useful to businesses that need to understand what actually has the greatest impact on interest in their product.
CBC challenges respondents to think about the value of an entire package of product features.

This helps simulate the choices a customer would be given in the real world.
In turn, businesses uncover insights that are more actionable. This leads them to data-driven decision-making about how to develop and market their products.
By conducting a conjoint analysis, your business can understand the relative value of any tested product feature.
This metric, referred to as a part-worth utility, is calculated for each level of each attribute you test in the survey.
Recommended Reading: Five Advanced Survey Question Examples
How to Do Choice-Based Conjoint Analysis
A conjoint analysis study can be conducted via many survey research platforms available today, either as a pre-built tool or a custom-built experimental design.
Like all online surveys at Drive Research, respondents can complete a CBC survey via desktop, tablet, or mobile phone.
The advanced survey design tools at our market research firm have various inputs to consider: sample size, choice type, number of cards per set, number of sets per respondent, attributes, attribute levels, and prohibited level pairs.

Below is a quick breakdown of each input:
- Sample size: The number of respondents who complete the survey. 100 to 200 respondents per segment you plan to analyze is a safe bet (i.e., age groups, customer segments).
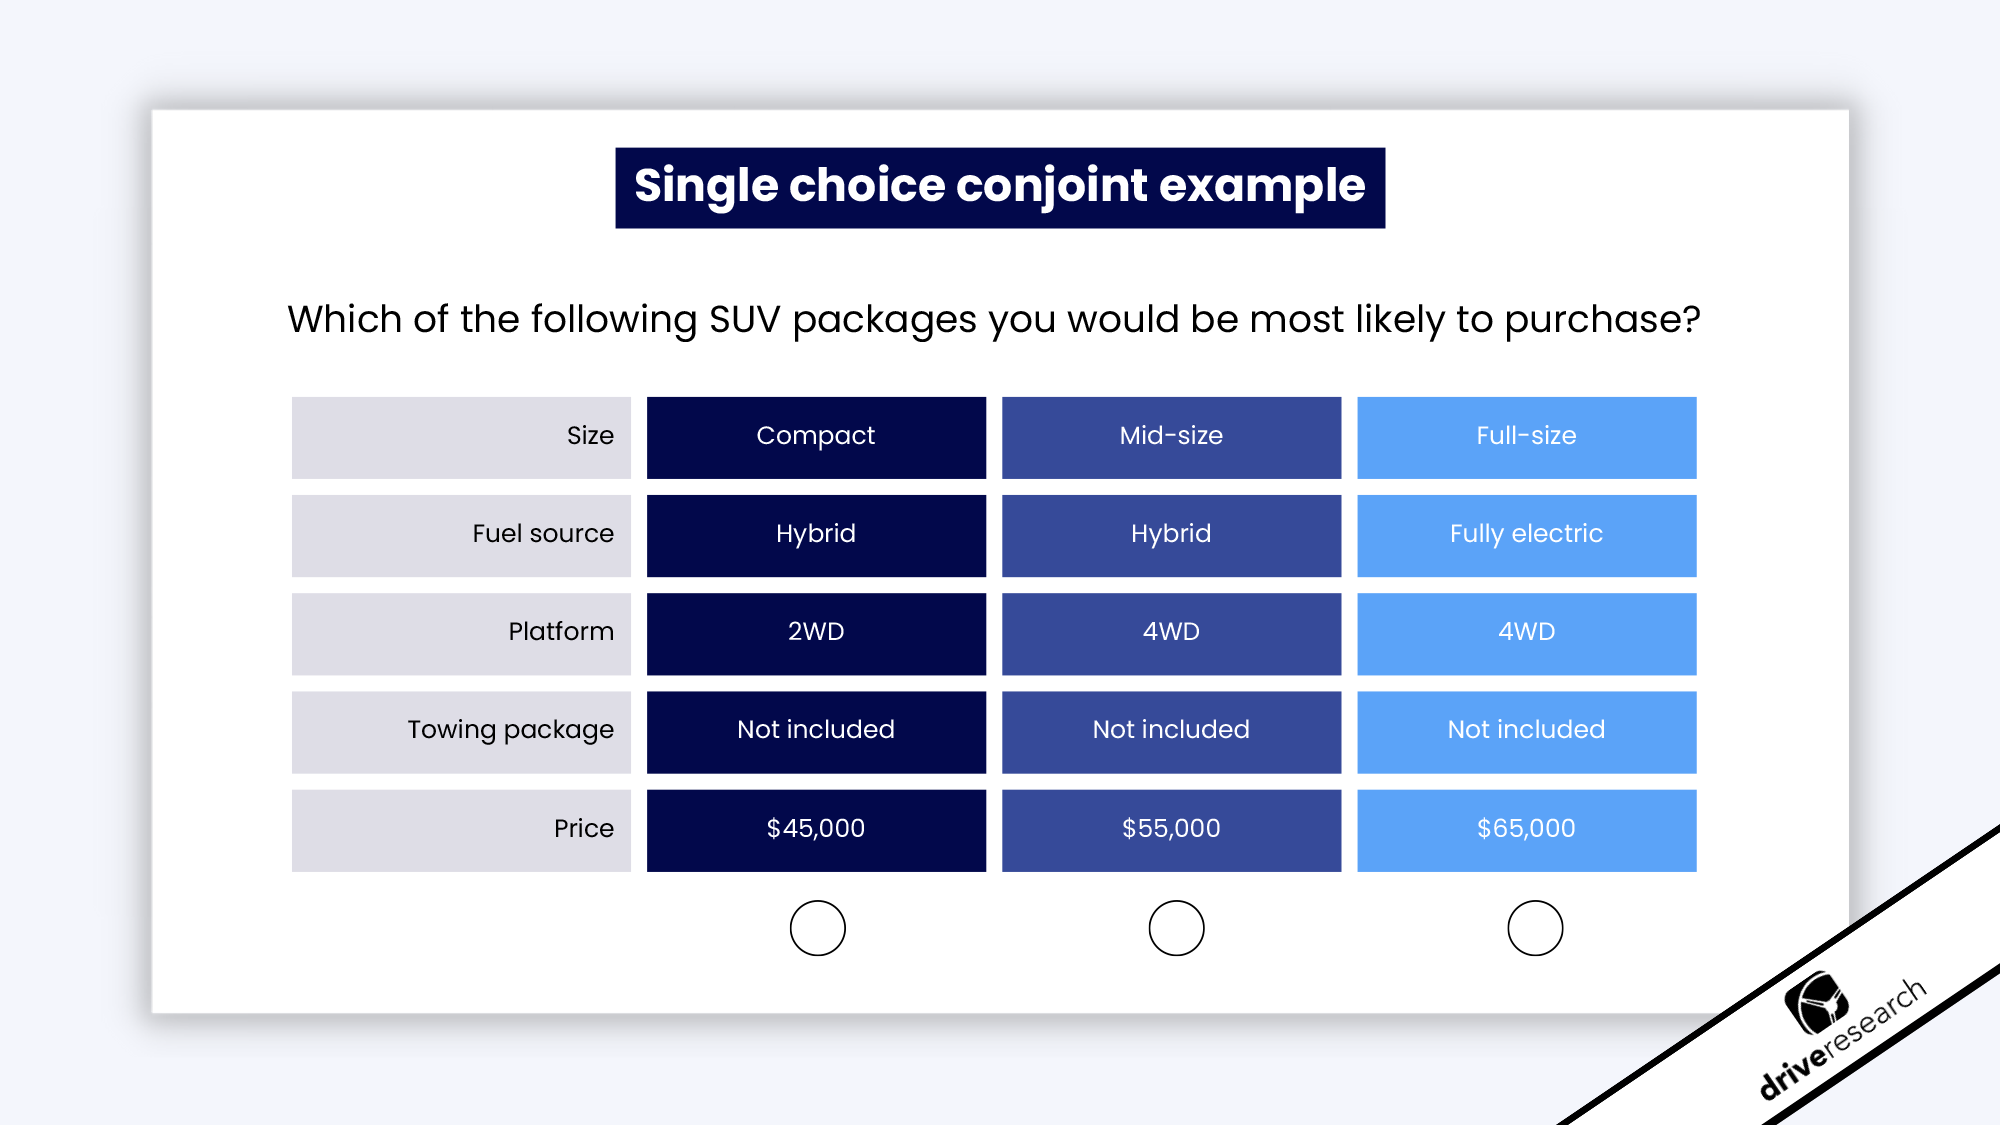
- Choice type: How respondents evaluate each set of cards (combinations of attribute levels). This can include Single Choice, Single Choice with none of the above option, Best vs. Worst, or Continuous Sum.
- Number of cards per set: The number of combinations presented to respondents for each set. Too many cards will fatigue respondents but too few will provide incomplete data.
- Number of sets per respondent: The number of sets each respondent must evaluate for the duration of the conjoint. Similar to the number of cards per set, too many sets will fatigue respondents but too few will provide incomplete data.
- Attributes: The feature categories for the product or service being tested. Common attributes might include price, size, color, and brand. A maximum of six attributes is good practice so as not to overwhelm respondents.
- Attribute levels: The different options for each attribute. These are usually somewhere between two to six levels to keep the number of combinations manageable for the respondent.
- Prohibited level pairs: Specific combinations of attribute levels you would like to exclude from the conjoint analysis. This might be used to prevent respondents from seeing unrealistic combinations of product features. However, it is advised to avoid prohibited level pairs because of their negative impact on accurate utility calculations.
Conducting choice-based conjoint surveys
After the survey is written and programmed based on the features above, it is sent to a target audience.
Respondents are shown randomized sets of cards to collect data on the various attributes and attribute levels.
It is critical to ensure no respondent is provided a set with the same combination of attribute levels more than once.
The ideal experimental design for a choice-based conjoint analysis is balanced and comprehensive.
Next, as fieldwork closes, statistical analysis is used to make sense of the raw data collected in the survey.
Here are a few things to keep in mind as you are reviewing the conjoint survey data:
- Part-worth utilities are deduced mathematically from respondent selections for each set (including a “None” option if present)
- These utilities correspond to each attribute level tested in the conjoint analysis.
- You will also be able to assess the relative importance of each attribute as a category related to the product.
⚠️ A word of caution if you are thinking about using conjoint analysis for your business ⚠️
Be sure to consult a market researcher or data scientist with experience in conducting conjoint analyses first.
There are many decisions to be made that can significantly influence the end results.
There are a handful of market research teams that can recommend a sound conjoint design and explain all the options available to your business.
Contact Drive Research to get a quote for a choice-based conjoint study with our market research company.
When to Use CBC Analysis
1. If you are looking to understand product market fit
One of the most common applications of conjoint analysis is to understand product market fit.
This is essentially identifying how well a product or service will translate into the real world if available to customers.
A key output of a choice-based conjoint study is a market simulator which allows the user to test various configurations of product features against each other and see the potential market shares.
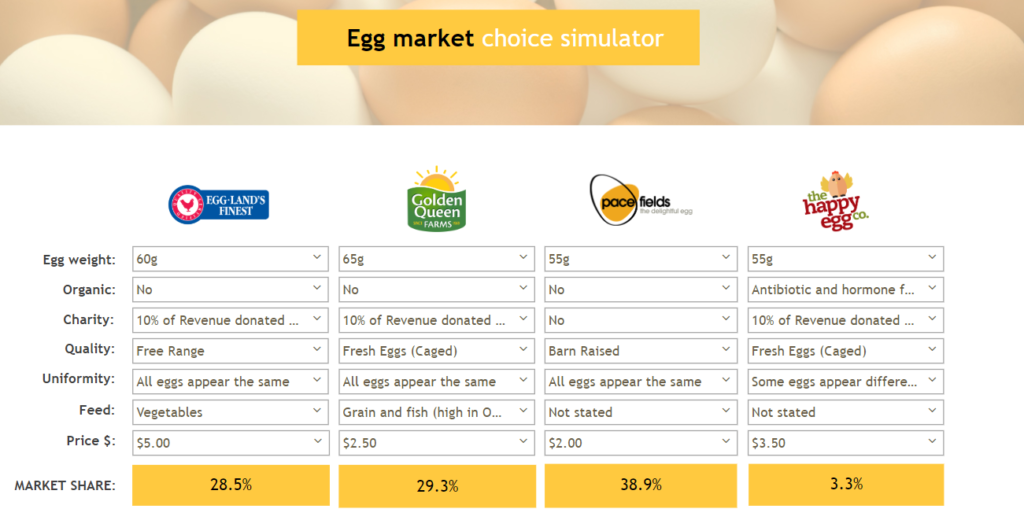
Image source: Q Research Software
2. If you are in the final stages of new product development
It might make sense to invest in a conjoint analysis study if you are at the tail end of product development.
The choice-based conjoint study can inform you which combination of attribute levels will offer the greatest chance of success if taken to market.
It can also inform you if there is no market for the product you are testing.
Either way, conjoint can greatly improve the effectiveness of where you invest next in the product development process.
3. If you are looking to improve an existing product
A discrete choice conjoint analysis may also be a good fit for those who want to understand how changes to their existing product (or a competitive product) could impact market share.
Fully fleshed-out products with moderate variations fit seamlessly into this type of market research.
On the contrary, conjoint analysis is probably not the best approach if you aren’t sure what attributes (price, quality, size, etc.) to test for your product or service.
If that is the case, be sure to conduct other research first to find out what the overarching elements of the product are.
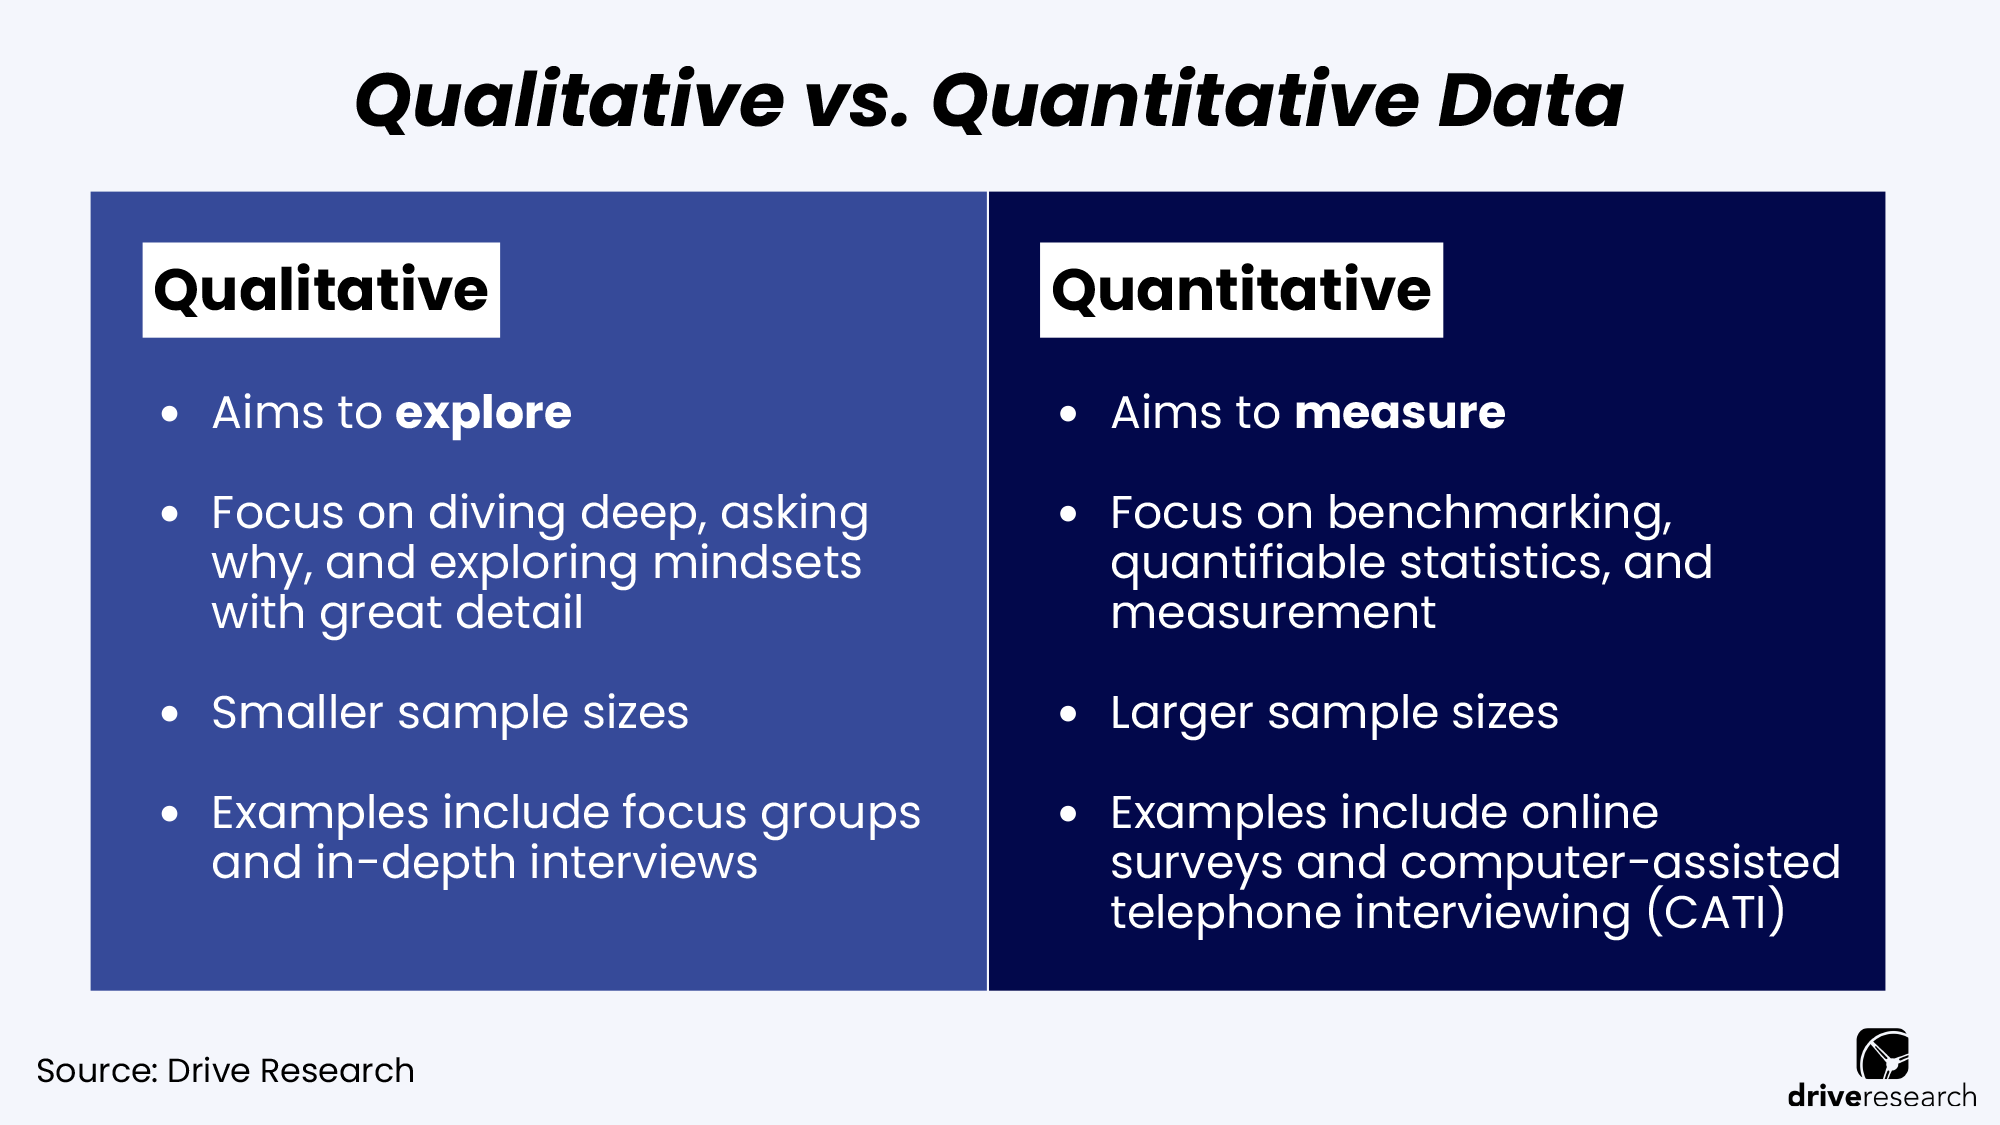
While both quantitative and qualitative market research are viable options, I'd recommend the latter. Qualitative research in particular can be helpful to explore what potential customers are looking for in your offering.
4. If pricing is a major question mark for your product or service
Choices for consumers often boil down to the perceived value of a product (benefits minus cost).
Therefore, many businesses incorporate a value-based pricing strategy with this in mind.
In a choice-based conjoint study, this takes the shape of weighing the given features of a card against its assigned price.
Testing price levels in a conjoint analysis also unveil insights regarding price sensitivity.
You are likely to discover how steep or flat the interest curve is as the price hypothetically changes.
You may even be able to run expected revenue calculations with the anticipated market share at each price level.
Recommended Reading: Using a Conjoint Choice-Based Model to Determine Product Cost
Example Choice-Based Conjoint Analysis Study
Now that we have covered what goes into a CBC analysis, let’s review an example.
Let’s say an appliance manufacturer (Brand A) is looking to launch a new refrigerator next year. The company is aware of the key attributes that go into the decision-making process for consumers but lacks an understanding of the best combination of features. They also would like to know how well their new refrigerator concept would perform in the current market among their competitors.
To address the objectives of the appliance manufacturer, a choice-based conjoint analysis can be utilized.
The design could include the following attributes and attribute levels.
| Brand | Price | Finish | Width | Layout | Touchscreen |
| Brand A | $750 | Stainless steel | 24 inches | French Door with Bottom Freezer | Includes a touchscreen |
| Brand B | $1,000 | White | 30 inches | Top freezer | Does not include a touchscreen |
| Brand C | $1,500 | Black | 33 inches | Bottom freezer | |
| Brand D | $2,000 | 36 inches | Side-by-side | ||
| $2,500 |
Other important inputs for the conjoint analysis include:
- A sample size of n1,500 respondents who have decision-making influence on appliance purchasing for their household. This would allow the appliance manufacturer to review the results by a handful of segments if desired.
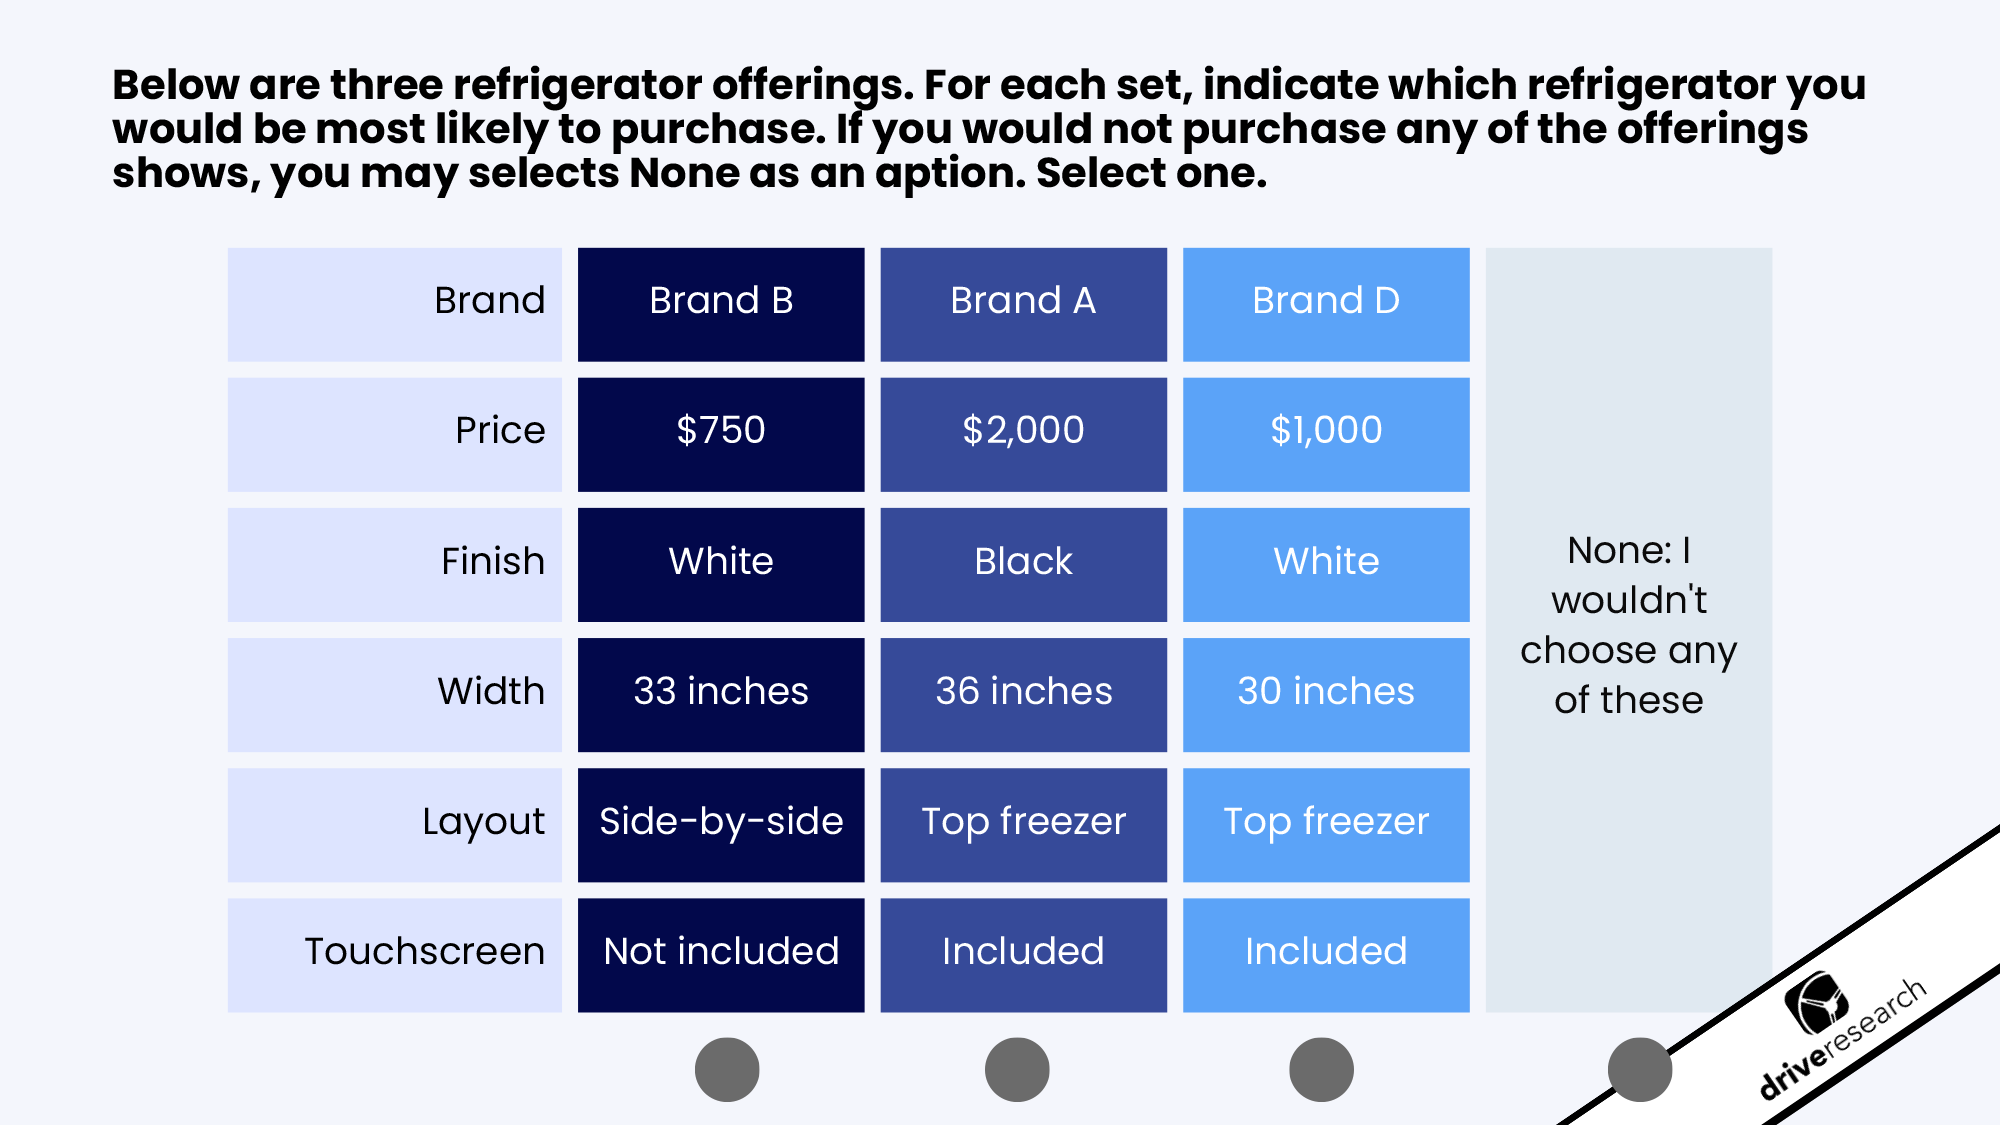
- Using a single-choice design with a “None” option for respondents to indicate if they would not purchase any of the provided combinations.
- Showing 3 cards for each set (not including the “None” option) and a total of 12 sets for each respondent.
Once the conjoint design is finalized and programmed into a survey platform, it will look something along the lines of the below example.
Respondents would complete 12 sets in this particular experimental design.
Not all combinations are necessarily something a consumer would encounter in the market, but these exercises reveal the individual importance of each attribute.
Analysis and reporting
Once fieldwork is completed, the choice-based conjoint analysis begins.
Drive Research leverages a conjoint tool that uses the research-level statistical library ChoiceModelR to calculate part-worth utilities for each attribute level.
The utility data can then be fed into a market simulator to estimate the market share for different refrigerators, assuming all were offered.
Researchers and clients can test as many combinations and comparisons as they would like using all the different attribute levels.
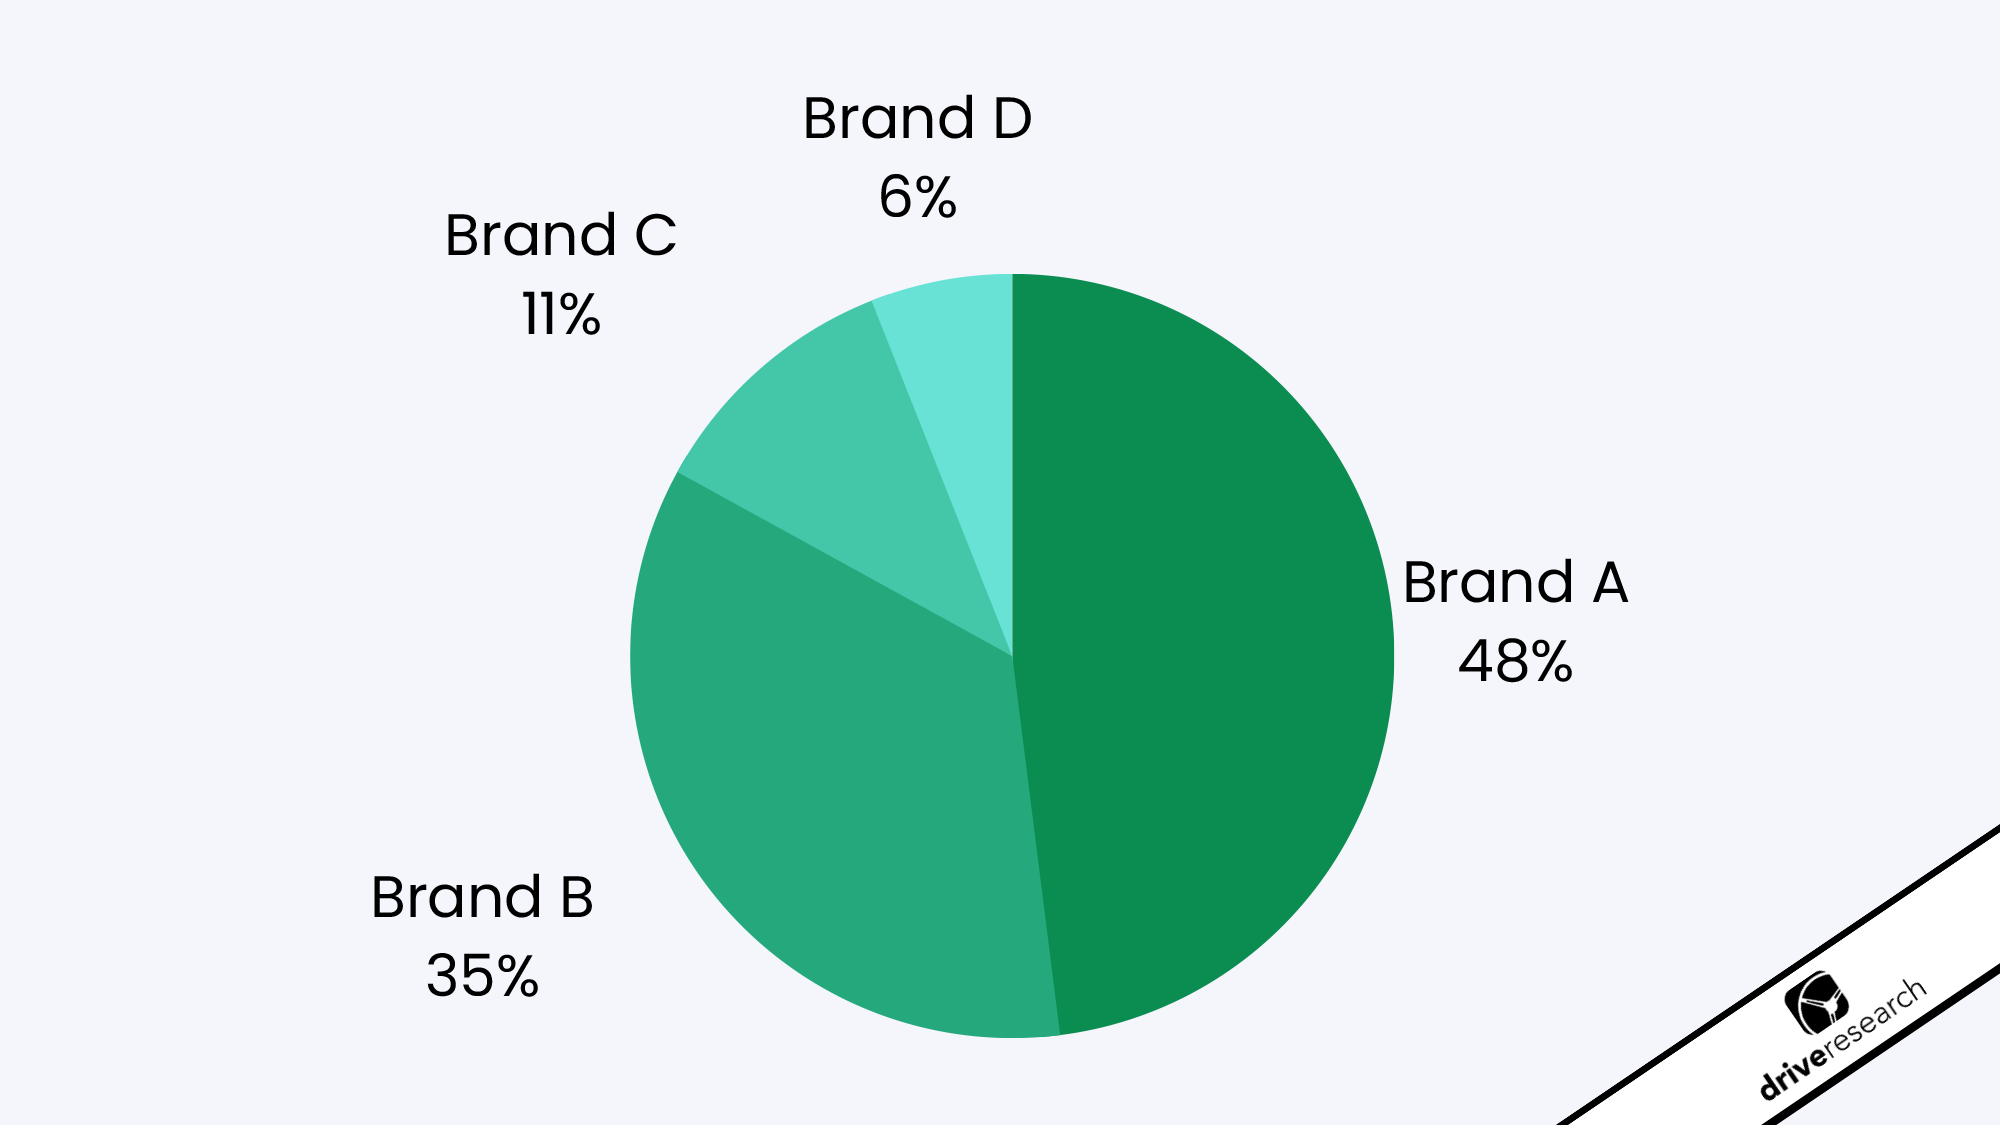
For example, from the sample data below, we can infer that Brand A has a promising concept on its hands versus the leading competition.
| Brand | Price | Finish | Width | Layout | Touchscreen | Market Share |
| Brand A | $1,500 | Stainless steel | 36 inches | Side-by-side | Included | 48% |
| Brand B | $1,500 | White | 36 inches | Bottom freezer | Not included | 35% |
| Brand C | $1,000 | Stainless steel | 30 inches | Top freezer | Included | 11% |
| Brand D | $750 | Black | 24 inches | Side-by-side | Not included | 6% |
Conduct a Choice-Based Conjoint Analysis with Drive Research
Drive Research is a national market research company specializing in quantitative and qualitative methodologies. Our team of research analysis conducts choice-based conjoint studies for types of organizations to determine the ideal product or service for their customers.
Interested in learning more about our market research services? Reach out through any of the four ways below.
- Message us on our website
- Email us at [email protected]
- Call us at 888-725-DATA
- Text us at 315-303-2040

Tim Gell
As a Senior Research Analyst, Tim is involved in every stage of a market research project for our clients. He first developed an interest in market research while studying at Binghamton University based on its marriage of business, statistics, and psychology.
Learn more about Tim, here.